Vegetation Outlook (VegOut)
The Vegetation Outlook (VegOut) is a new experimental tool that provides future outlooks of general vegetation conditions. VegOut integrates climate information and satellite-based observations of current vegetation conditions with oceanic index data and other biophysical information about the environment (i.e., land cover type, irrigation status, soils, and ecological setting) to produce 1-km2 resolution maps of projected general vegetation conditions into the future. The VegOut utilizes the inherent time-lag relationship between climate and vegetation response and considers teleconnections between the ocean and climate patterns over the continental U.S. Current research is focusing on the development of 2-, 4-, and 6-week Vegetation Outlooks in the U.S. Great Plains. Alternative modeling techniques and new inputs into the current VegOut models are also being investigated in an effort to provide more accurate predictions of future vegetation conditions. Expansion of VegOut to other parts of the U.S. is also planned. Interests on the VegOut model and products in other countries are also observed.
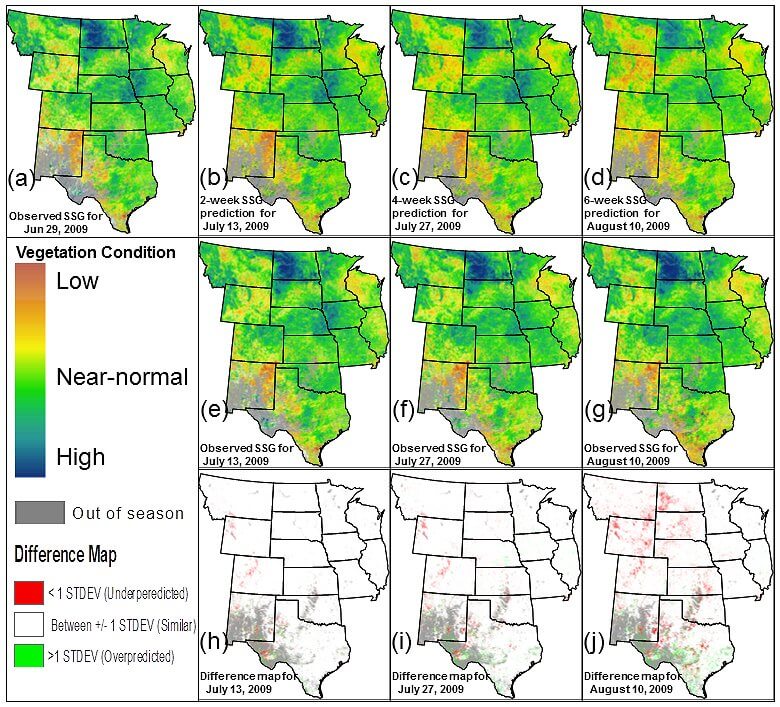
Figure. (a) Observed seasonal greenness (SSG) for June 29, 2009; (b), (c), and (d) are 2-, 4-, and 6-week outlooks; (e), (f), and (g) are observed SSG for July 13, July 27, and August 10 that correspond to the 2-, 4-, 6-week outlooks, respectively; and (h), (i), and (j) show the difference between the predicted and observed greenness for the corresponding 2-, 4-, and 6-week outlooks, respectively.
Research Participants: National Drought Mitigation Center (NDMC), USDA Risk Management Agency (RMA), and High Plains Regional Climate Center (HPRCC)
For additional information, contact: Dr. Brian Wardlow (bwardlow2@unl.edu) or Dr. Tsegaye Tadesse (ttadesse2@unl.edu)
Normalized Difference Water Index (NDWI) and Normalized Difference Drought Index (NDDI)
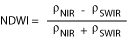
The Normalized Difference Water Index (NDWI), which is calculated from the 500 meter near-infrared (NIR) and shortwave-infrared (SWIR) data from the Moderate Resolution Imaging Spectroradiometer (MODIS) (Equation 1), is being investigated for large-area drought monitoring.
(1) 
NWDI holds considerable potential for drought monitoring because the two spectral bands used in its calculation are responsive to changes in the water content (SWIR band) and inter-cellular air spaces of the spongy mesophyll layer of leaves in the vegetation canopy. As a result, NWDI is influenced by both the dessication and wilting of vegetation and may be a more sensitive drought indicator than traditional remote sensing-based indices such as the Normalized Difference Vegetation Index (NDVI), which do not account for changes in the vegetation's water content.
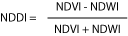
A new vegetation drought indicator, the Normalized Difference Drought Index (NDDI), is also being researched. The NDDI combines information from both the NDWI and NDVI data derived from MODIS as shown in equation 2.
(2) 
Initial research investigated the potential of the NDDI, NDWI, and NDVI for drought monitoring over the tallgrass prairie of the Flint Hills region in eastern Kansas and northeast Oklahoma and the results were encouraging. NDWI was found to be more sensitive that NDVI to the onset of drought conditions. NDDI was also found to be more responsive and have wider dynamic range values than a simple NDVI-NDWI differencing through drought periods. Further information on this research is provided by Gu et al. (2007).
Drought years were 2002 and 2003. Climate conditions for the other years were near normal or above normal.
Research Participants: National Drought Mitigation Center (NDMC), USGS Center for EROS, USDA Risk Management Agency (RMA), and High Plains Regional Climate Center (HPRCC)
For additional information, contact: Dr. Brian Wardlow (bwardlow2@unl.edu) or Jesslyn Brown (jfbrown@usgs.gov)